

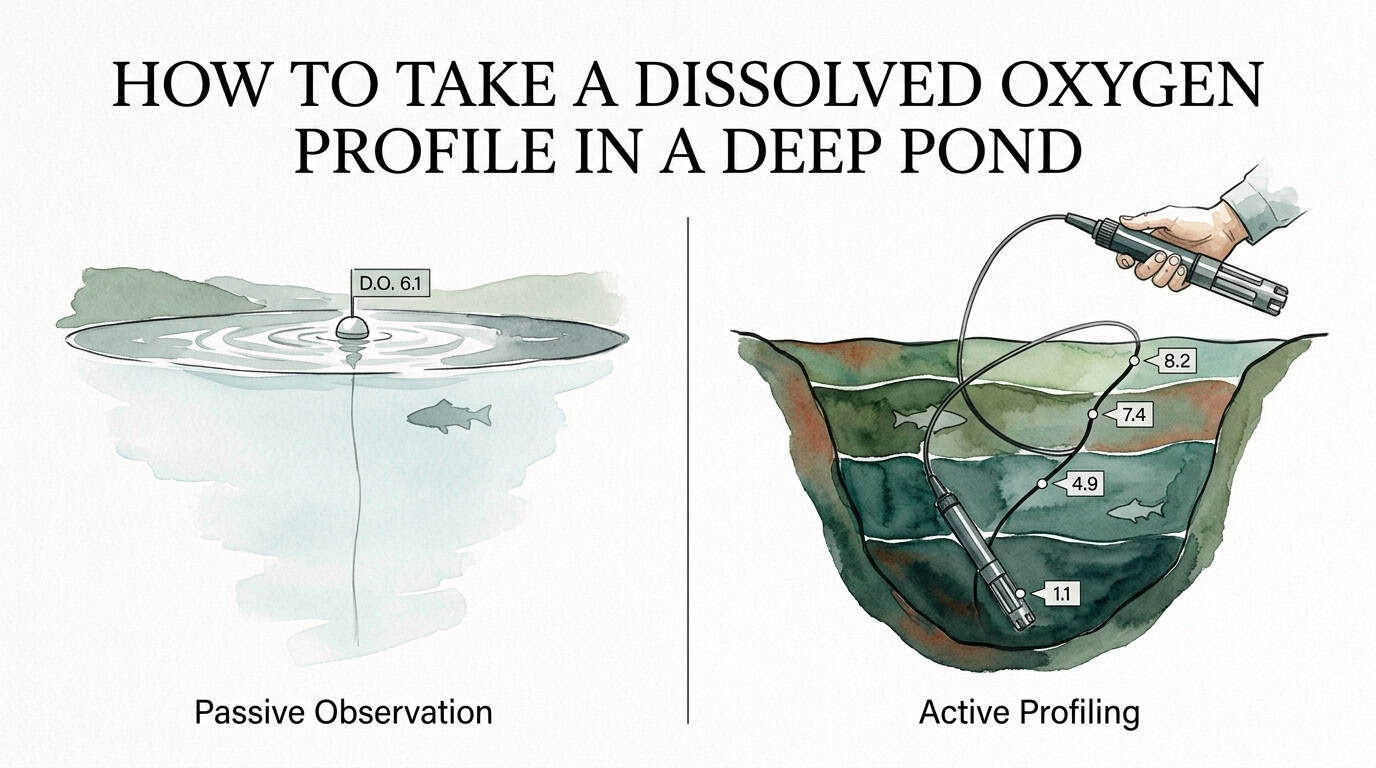
Fish kills happen when you do not see them coming. Active profiling is your early warning system. Oxygen levels change drastically with depth. Learn how to create a dissolved oxygen profile to protect your pond.
To take a dissolved oxygen profile in a deep pond, lower a calibrated dissolved oxygen meter with a sufficiently long cable into the water, recording oxygen and temperature readings at consistent depth increments, typically every 2 to 5 feet. Start at the surface and continue until the probe reaches the bottom. This systematic data collection allows you to identify the thermocline and oxycline, providing a map of the pond’s life-sustaining zones.
How to Take a Dissolved Oxygen Profile in a Deep Pond
A dissolved oxygen (DO) profile is a vertical map of oxygen concentration and temperature from the surface of a water body to its floor. In deep ponds, specifically those exceeding 20 feet, the water column does not maintain a uniform oxygen level. Instead, it stratifies into distinct layers based on density and temperature. Profiling is the mechanical process of measuring these layers to determine where aquatic life can survive and where toxic, anaerobic conditions exist.
In a real-world scenario, a pond may appear healthy at the surface while the bottom 40 feet are completely devoid of oxygen. This “dead zone” occurs because sunlight cannot penetrate deep enough to support photosynthesis, and the density difference between warm surface water and cold bottom water prevents atmospheric oxygen from mixing downward. Professional pond managers use profiling to determine the exact depth of the thermocline—the transition layer between warm and cold water—and the oxycline, where oxygen levels drop precipitously.

This data is critical for aquaculture, trophy fisheries, and raw water reservoir management. Without a profile, any management action, such as installing an aeration system or applying algaecides, is based on guesswork. A profile provides the hard data required to calculate the biological oxygen demand (BOD) and the volume of the hypoxic zone.
How to Conduct a Deep Water Profile Step-by-Step
Executing a precise DO profile requires specific equipment and a disciplined methodology. In deep water environments (40–80 feet), standard handheld probes often lack the cable length or pressure ratings required for accurate measurement.
1. Equipment Selection and Preparation
Utilize a professional-grade DO meter, such as an optical (RDO) or polarographic sensor. For depths up to 80 feet, ensure the cable is at least 100 feet long and clearly marked at one-foot or one-meter intervals. Optical sensors are preferred for deep profiling because they do not require water movement across the membrane to function, whereas membrane-based electrochemical probes require constant agitation to provide a stable reading.
2. Calibration Protocols
Calibrate the instrument at the pond site immediately before use. Accurate calibration must account for barometric pressure and altitude. Most high-end meters feature an internal barometer to automate this. If using a membrane-style probe, ensure the electrolyte solution is fresh and the membrane is free of bubbles or tears.
3. Station Positioning
Navigate to the deepest part of the pond. Use a weighted line or a high-resolution fish finder to verify the maximum depth. Secure the boat using a two-point anchoring system to prevent drifting, which can cause the probe cable to angle, resulting in inaccurate depth readings.
4. Initial Surface Reading
Lower the probe approximately 6 inches below the surface. Allow the sensors to stabilize for 60 to 90 seconds. Record the temperature in degrees Celsius or Fahrenheit and the DO in milligrams per liter (mg/L) and percent saturation.

5. Incremental Descent
Lower the probe in 2-foot increments for the first 20 feet, as this is where the most rapid changes often occur. Beyond 20 feet, increments can be expanded to 5 feet if the data remains stable. However, if the temperature drops by more than one degree per foot, you have hit the thermocline; return to 1-foot increments to map this transition precisely.
6. Reaching the Benthos
Continue the descent until the probe makes contact with the bottom sediment. Be careful not to bury the probe in the “muck” layer, as this will result in a false zero reading and may contaminate the sensor. Record the final bottom reading and slowly retrieve the cable.
Benefits of Active Profiling in Deep Ponds
Active profiling offers measurable advantages over surface-level testing. Relying on surface data is often misleading, as the top 3 feet of water are typically well-oxygenated by wind and photosynthesis, even if the rest of the pond is in crisis.
Identifying the Living Space
Most sport fish, such as bass or trout, require DO levels above 5 mg/L for optimal growth. Profiling reveals the “squeeze” zone—a situation where the surface is too hot for the fish and the deep water is too low in oxygen. Knowing the exact depth of the oxygenated layer allows managers to understand the true carrying capacity of the pond.
Preventing Catastrophic Turnover
Deep ponds are at risk of “turnover,” a phenomenon where a cold rain or strong wind causes the oxygen-depleted bottom water to mix suddenly with the surface water. This can drop the overall DO of the pond to lethal levels within minutes. Active profiling allows you to see the volume of anaerobic water accumulating at the bottom, providing a metric to determine when a turnover is most dangerous.
Optimizing Aeration Efficiency
If you are installing a bottom-diffused aeration system, profiling tells you exactly where to place the diffusers. Placing a diffuser too deep in a stratified pond can cause an immediate fish kill by forcing an artificial turnover. Data from the profile ensures the system is sized correctly to handle the specific oxygen deficit of the hypolimnion.
Challenges and Common Mistakes
The primary challenge in deep-water profiling is the “cable angle” error. In even a slight breeze, the probe acts as an anchor, and the cable bows. This makes the probe appear deeper than it actually is. To avoid this, use a 2-pound lead weight attached 12 inches above the probe to keep the cable vertical.
Ignoring Temperature Stabilization
Deep water is significantly colder than surface water. Sensors require time to adjust to these thermal changes. Recording a reading before the sensor has reached thermal equilibrium will result in “drift,” where the DO value slowly crawls up or down as the sensor cools. Always wait for the “ready” indicator on digital meters.
Neglecting Salinity Compensation
While most ponds are freshwater, high-conductivity environments or those with high mineral content require salinity compensation. Dissolved salts reduce the solubility of oxygen. Failure to input the correct conductivity or salinity value into the meter will result in overestimating the available oxygen.
Poor Data Incrementation
Taking readings every 10 feet is insufficient for deep ponds. The thermocline can be as thin as 3 to 5 feet. If your increments are too wide, you will miss the exact depth where the oxygen crashes, leading to a flawed understanding of the pond’s stratification.
Limitations of Profiling
Profiling provides a “snapshot” in time. Oxygen levels are dynamic and change based on the diurnal cycle (day vs. night). A profile taken at 2:00 PM during peak photosynthesis will look vastly different from one taken at 4:00 AM after hours of respiration.
Environmental Constraints
Extreme weather events, such as heavy thunderstorms, can temporarily disrupt stratification. Profiling during or immediately after such events may provide data that does not reflect the pond’s “normal” state. Additionally, in very high-turbidity ponds, the weight of the suspended solids can interfere with the sensitivity of certain electrochemical sensors.
Technical Boundaries
Handheld DO meters have a maximum depth rating for their pressure seals. Exceeding this depth can implode the sensor or force water into the cable housing. Always verify the PSI or depth rating of your equipment before attempting to profile an 80-foot pond.
Passive Observation vs. Active Profiling
Understanding the difference between passive observation and active profiling is the distinction between reacting to a problem and preventing one.
| Factor | Passive Observation | Active Profiling |
|---|---|---|
| Primary Data Source | Visual cues (fish gasping, water color). | Digital sensor measurements. |
| Depth Accuracy | Surface only. | Full water column (Surface to Benthos). |
| Lead Time | Zero; identifies problems as they occur. | High; predicts issues weeks in advance. |
| Complexity | Low; requires no equipment. | Moderate; requires calibrated instruments. |
| Cost | $0 (until fish die). | Investment in DO meter ($500 – $2,000). |
Practical Tips and Best Practices
For the most accurate results, adhere to these technical standards:
- Profile during the “Critical Window”: Conduct your profile in the late summer when stratification is at its peak. This represents the “worst-case scenario” for oxygen levels.
- Mark the Cable: Use waterproof tape or heat-shrink tubing to mark every 5 feet on your probe cable. This prevents you from having to measure the cable manually in the boat.
- Check the Battery: DO sensors use significant power for polarization (electrochemical) or the LED (optical). A low battery can cause the meter to “jump” or provide erratic readings.
- Graph Your Data: Do not just look at the numbers. Plot your findings on a graph with Depth on the Y-axis and DO/Temperature on the X-axis. This visual representation makes the thermocline and oxycline immediately obvious.
- Standardize Your Units: Always record data in mg/L. Percent saturation is useful for understanding gas exchange, but mg/L is the absolute metric used for biological thresholds.
Advanced Considerations for Deep Ponds
Serious practitioners should consider the “Oxy-Thermal Squeeze.” In deep ponds, as the summer progresses, the epilimnion (top layer) becomes too warm for certain species, while the hypolimnion (bottom layer) becomes anoxic. This forces fish into a narrow band of water that may be only 2–3 feet thick. If this band disappears, a massive fish kill is inevitable regardless of surface conditions.
Furthermore, consider the impact of “Internal Loading.” When the bottom of a deep pond stays anaerobic for months, the chemistry of the sediment changes. Phosphorus, which is usually bound to iron in the sediment, is released back into the water column. When the pond eventually turns over in the fall, this massive pulse of phosphorus can trigger a catastrophic algae bloom. Profiling helps you identify when the bottom is becoming anoxic enough to trigger this nutrient release.
Examples of Profiling Scenarios
Scenario: The 50-Foot Quarry Pond
A manager profiles a 50-foot deep quarry pond in July.
– Surface: 28°C, 8.2 mg/L DO.
– 10 Feet: 27.5°C, 7.8 mg/L DO.
– 20 Feet (Thermocline): Temperature drops from 26°C to 18°C in three feet. DO drops from 7.0 mg/L to 2.1 mg/L.
– 30-50 Feet: 12°C, 0.4 mg/L DO.
Analysis: The bottom 30 feet of the pond are uninhabitable. Any fish caught below 20 feet will likely experience immediate respiratory stress. The manager should not install a bottom aerator without first “bleeding” the system slowly to avoid pushing 30 feet of toxic water to the surface.
Scenario: The Aerated 40-Foot Pond
A manager profiles a pond where a bottom diffuser has been running all summer.
– Surface to 40 Feet: Temperature remains between 24°C and 26°C. DO remains between 6.5 and 7.2 mg/L.
Analysis: The aeration system is successfully “destratifying” the pond. There is no thermocline, and oxygen is being carried to the benthos. This pond is at zero risk for a fall turnover fish kill.
Final Thoughts
Active dissolved oxygen profiling is a fundamental requirement for the responsible management of deep ponds. It moves the manager from a state of reactive uncertainty to one of data-driven precision. By mapping the vertical distribution of oxygen, you gain the ability to predict thermal stress, nutrient spikes, and potential fish kills long before they manifest at the surface.

Consistent data collection over several seasons will reveal the unique “personality” of your pond. You will learn how it responds to heatwaves, heavy rains, and seasonal shifts. This knowledge is the most powerful tool available for maintaining a healthy, balanced, and productive aquatic ecosystem.
Frequently Asked Questions About How to Take a Dissolved Oxygen Profile in a Deep Pond
How often should I take a dissolved oxygen profile?
For most deep ponds, a monthly profile during the growing season (spring through fall) is sufficient to track the development of stratification. However, during periods of extreme heat or after heavy algae blooms, weekly profiling is recommended. The goal is to identify the formation of the thermocline and monitor how the oxygen-depleted zone expands or contracts. If you are managing a high-density aquaculture system or a sensitive trophy fishery, more frequent testing may be required to catch rapid shifts in biological oxygen demand before they reach critical thresholds.
What is the difference between an optical and an electrochemical DO probe?
Electrochemical probes, such as polarographic or galvanic sensors, use a membrane and a chemical reaction to measure oxygen. They require the water to be moving across the membrane (stirring) to get an accurate reading. Optical probes, or RDO sensors, use fluorescence quenching to measure oxygen. They are generally more stable, do not require water movement, and are less susceptible to “poisoning” by gases like hydrogen sulfide, which are common in the deep, anaerobic layers of a pond. For deep profiling where stirring the probe 60 feet down is difficult, optical probes are the superior choice.
At what oxygen level do fish start to die in a deep pond?
While tolerance varies by species, most warm-water fish (like bass and bluegill) begin to experience significant stress when DO levels drop below 3.0 mg/L. Levels below 2.0 mg/L are often fatal if the fish cannot move to a more oxygenated area. Cold-water species like trout are even more sensitive, requiring levels above 5.0 mg/L to thrive. In a deep pond, the danger is not just the absolute DO level, but the lack of “refuge” if the surface water becomes too hot and the deep water becomes hypoxic simultaneously.
Can I use a simple titration kit to take a deep water profile?
While a Winkler titration kit is highly accurate, it is extremely difficult to use for deep-water profiling. To use it, you would need a specialized Van Dorn or Kemmerer water sampling bottle to retrieve a discrete water sample from a specific depth without allowing it to mix with atmospheric oxygen or water from other layers. This process is time-consuming and labor-intensive compared to a digital meter. Digital probes provide real-time data as you lower the sensor, making it the only practical method for detailed vertical profiling in deep water.
Why does the oxygen level sometimes increase just above the thermocline?
This phenomenon is known as a metalimnetic oxygen minimum or maximum. In many ponds, a “spike” in oxygen occurs just above the thermocline because algae often settle at this density boundary. If sunlight can still reach this depth, the algae will continue to photosynthesize, producing a localized layer of high oxygen. Conversely, if dead algae accumulate there and begin to decompose, you may see a sharp dip in oxygen. Profiling at 1-foot increments through the thermocline is the only way to detect these critical micro-layers.