

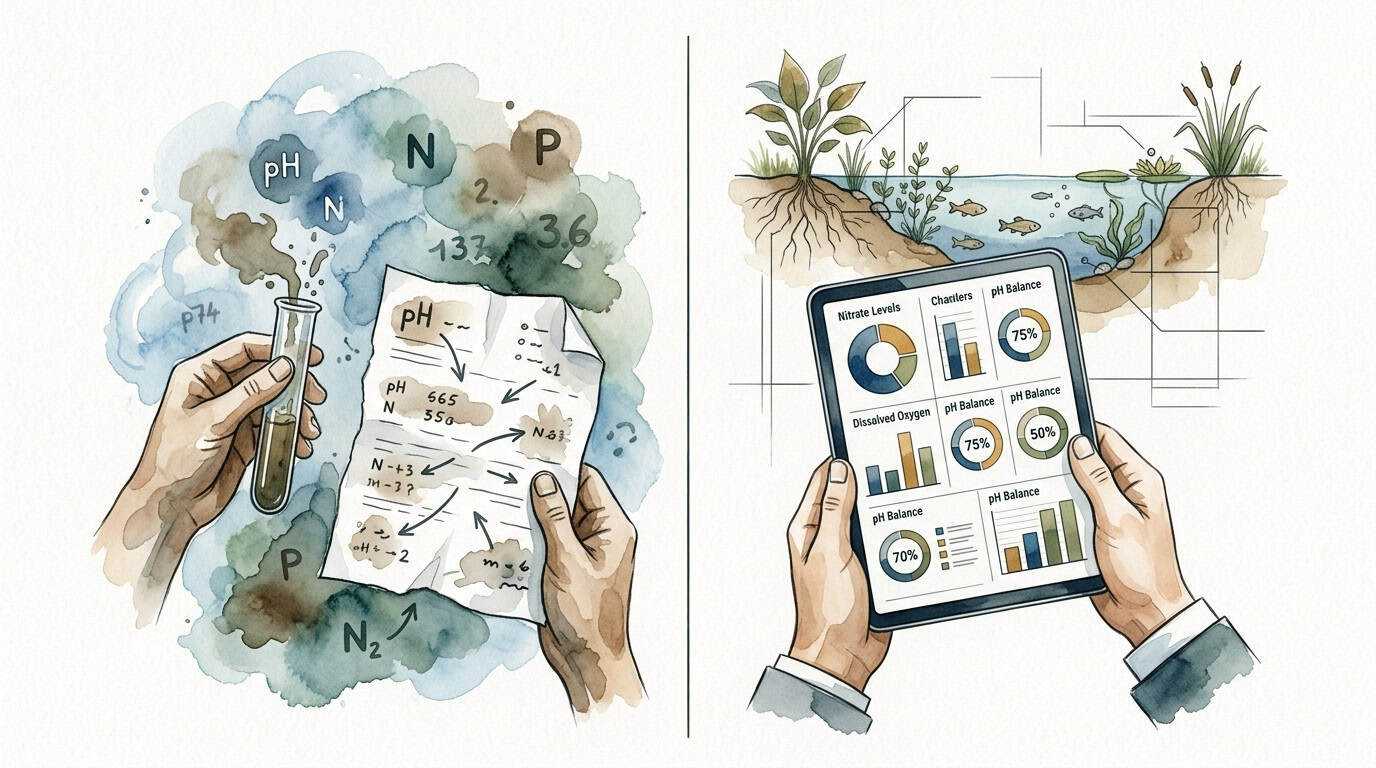
Stop guessing and start reading the data like a pro. A water test report is a roadmap, not just a list of numbers. Learn how to spot the trends that lead to algae before they start.
Reading a pond water test report like a professional involves evaluating the chemical interdependencies between nutrients, buffering capacity, and nitrogenous waste rather than looking at isolated figures. Professionals analyze the ratio of un-ionized ammonia to total ammonia based on pH and temperature, monitor alkalinity to ensure nitrification stability, and track phosphate-to-nitrate ratios to predict algal blooms. This systematic interpretation allows for precise mechanical and biological optimizations before water quality degrades.
How to Read a Pond Water Test Report Like a Professional
A professional water test report is a comprehensive quantitative assessment of a pond’s chemical and biological health. It exists to provide a baseline for the nitrogen cycle, mineral content, and nutrient loading within an aquatic system. In real-world applications, these reports allow pond managers and aquaculture professionals to calculate chemical dosing requirements, evaluate filtration efficiency, and ensure the survival of sensitive aquatic species.
Data within these reports typically covers the primary nitrogenous compounds: ammonia, nitrite, and nitrate. It also includes “the big three” of stability: pH, carbonate hardness (KH), and general hardness (GH). Advanced reports may further include Dissolved Oxygen (DO), Oxidation-Reduction Potential (ORP), and Electrical Conductivity (EC). Understanding these metrics requires viewing the pond not as a static body of water, but as a dynamic chemical reactor where every parameter influences another.

How the Nitrogen Cycle Data Interacts
Interpreting the nitrogen cycle is the primary task of any professional water analysis. The process begins with the measurement of Total Ammonia Nitrogen (TAN). Ammonia exists in two forms in water: un-ionized ammonia (NH3), which is highly toxic, and ionized ammonia (ammonium, NH4+), which is relatively harmless. The ratio of these two forms is governed strictly by pH and temperature.
Professional reports often provide a single TAN value. A professional must then use a dissociation table or the Henderson-Hasselbalch equation to determine the actual concentration of toxic NH3. At a pH of 7.0 and a temperature of 20°C, only about 0.4% of the TAN is toxic. If the pH rises to 8.5 at the same temperature, the toxic fraction increases to approximately 11%. This explains why a “safe” ammonia reading in a low-pH pond can become a “lethal” reading if the pH is suddenly raised.
Nitrite (NO2) is the next stage in the cycle. Professionals look for a value of absolute zero. Any detection of nitrite indicates that the Nitrobacter or Nitrospira bacterial colonies are lagging behind the Nitrosomonas colonies. Nitrite toxicity is particularly dangerous because it causes methemoglobinemia, often called “brown blood disease,” where the fish’s blood loses its ability to transport oxygen. Professionals often counter-act temporary nitrite spikes by adding chloride (salt), which competes with nitrite at the gill membrane, reducing uptake.
Nitrate (NO3) is the end product of aerobic nitrification. While less toxic than ammonia or nitrite, high levels (above 50 mg/L) can inhibit growth and contribute to eutrophication. Professionals use nitrate trends to determine the frequency and volume of required water changes or the need for increased vegetative filtration (phytoremediation).
The Role of Alkalinity and pH Stability
Alkalinity, measured as Carbonate Hardness (KH), is the most overlooked metric by beginners but the most critical for professionals. Alkalinity represents the buffering capacity of the water—its ability to resist pH swings. Nitrification is an acidifying process. For every 1 mg of ammonia oxidized into nitrate, approximately 7.14 mg of calcium carbonate (alkalinity) is consumed.
A professional reading a report will immediately flag a KH value below 50 ppm (3 °dKH) as a high-risk scenario. Without sufficient KH, the pH can “crash,” dropping rapidly and stalling the biological filter, which leads to toxic ammonia spikes. Professionals maintain KH levels between 100 and 200 ppm to ensure the “battery” of the pond is always charged, providing a stable environment for both fish and beneficial bacteria.

pH itself is a logarithmic measurement of hydrogen ion concentration. While most pond life thrives between 6.5 and 8.5, the stability of the pH is more important than the absolute value. Professionals look for diurnal swings. If the pH is 7.5 in the morning and 9.0 in the evening, the report suggests a high rate of photosynthesis (algae or heavy plant growth), which depletes carbon dioxide and drives the pH upward.
Benefits of Professional Interpretation
Precise data interpretation offers measurable operational advantages. Instead of applying broad-spectrum “clear water” treatments, a professional uses the report to target specific deficiencies. This results in significant cost savings on water treatments and chemical additives.
A key benefit is the ability to predict algae blooms before they occur. By monitoring the “limiting nutrient,” which is usually phosphorus in freshwater systems, a manager can see a rising trend and apply a lanthanum-based phosphate binder or increase UV-C sterilization before the water turns green. This proactive stance maintains aesthetic clarity and prevents the oxygen crashes associated with sudden algae die-offs.
Furthermore, interpreting General Hardness (GH) ensures proper osmoregulation in fish. GH measures calcium and magnesium ions. If these levels are too low, fish expend excessive energy maintaining internal salt balances, which weakens their immune systems. Professionals use GH data to ensure the mineral content supports skeletal development and enzyme function.
Challenges and Common Pitfalls
Testing errors represent the most significant challenge in reading reports. Reagent expiration is a frequent cause of “false zeros” in nitrate and phosphate tests. Professionals cross-validate results using different testing methods or by testing a known reference solution.
Another pitfall is the “snapshot” nature of water testing. A single sample taken at 2:00 PM will look very different from a sample taken at 2:00 AM. Dissolved oxygen is at its peak during the day due to photosynthesis but can drop to lethal levels just before dawn as plants and algae switch to respiration, consuming oxygen and releasing CO2. Professionals address this by taking samples at consistent times or using continuous digital monitoring.
Contamination during sampling is also common. Using a container that previously held soap or fertilizer can completely invalidate a report. Professionals use triple-rinsed, dedicated sampling vials and take water from at least 12 inches below the surface to avoid atmospheric interference.
Limitations of Water Testing
Water tests provide a chemical profile but do not account for physical or mechanical variables. A report may show perfect water parameters while the fish are dying from a parasitic outbreak or a mechanical failure in the aeration system. Chemistry is only one pillar of pond management; it must be viewed alongside biological observation and mechanical maintenance.
Additionally, most standard tests measure dissolved nutrients, not the nutrients bound in the sediment (the benthos). A pond might have low phosphate in the water column while the sludge at the bottom is a massive reservoir of phosphorus waiting to be released by a temperature spike or a storm. Professional-grade sediment testing is required to understand the total nutrient load of an older pond.
Titration vs. Digital Photometry
Professionals often choose between manual titration kits and digital photometers. While both have their place, the choice depends on the required precision and the volume of testing.
| Metric | Manual Titration (Liquid Kits) | Digital Photometry (Colorimeters) |
|---|---|---|
| Accuracy | Moderate; subject to human color perception. | High; provides precise numerical digital readouts. |
| Initial Cost | Low ($30 – $100). | High ($300 – $1,500). |
| Speed | Slow; involves counting drops and waiting. | Fast; instantaneous reading after reagent reaction. |
| Portability | Excellent; no batteries required. | Good; usually battery-operated but delicate. |
| Best For | Routine weekly maintenance and beginners. | Professional consulting and research-level data. |
Practical Tips for Accurate Reporting
Establish a baseline by testing the source water (tap or well water) before it enters the pond. Knowing the starting levels of minerals and nutrients allows you to differentiate between what is being introduced and what is being produced within the pond ecosystem.
Keep a detailed logbook or digital spreadsheet of every test result. One-off numbers are less valuable than trends. A nitrate level that rises from 5 ppm to 20 ppm over three weeks tells a story of increasing organic load that requires a filter cleaning or a reduction in feeding.
Hold reagent bottles perfectly vertical during titration. Holding the bottle at an angle changes the drop size, which can skew the results by as much as 25%. This simple mechanical adjustment is a hallmark of professional testing technique.
Advanced Considerations: ORP and Conductivity
Serious practitioners often look at Oxidation-Reduction Potential (ORP), measured in millivolts (mV). ORP measures the “cleansing power” or oxidative capacity of the water. High ORP (above 300 mV) indicates that the water is efficiently breaking down organic waste. A falling ORP is an early warning sign that the pond is becoming overloaded with organics, even if ammonia and nitrite still read zero.
Electrical Conductivity (EC) or Total Dissolved Solids (TDS) measures the total concentration of dissolved ions. In an established pond, a rising TDS over time suggests that water changes are insufficient. As water evaporates, minerals and pollutants stay behind and concentrate. Monitoring TDS allows professionals to manage “old water syndrome” by executing small, frequent water changes to keep the ionic balance stable.
Example Scenario: The High pH Ammonia Spike
Consider a pond report showing a TAN of 2.0 ppm, a pH of 9.2, and a temperature of 25°C. A beginner might see 2.0 ppm ammonia and think it is high but manageable. A professional recognizes that at a pH of 9.2 and 25°C, nearly 20% of that ammonia is in the toxic NH3 form. This results in a toxic ammonia concentration of 0.4 ppm, which is lethal to many fish species within hours.
In this scenario, the professional does not just perform a water change. They first address the pH. By adding a buffer to lower the pH to 7.5, the toxic NH3 fraction drops to less than 2%, instantly making the water safer while the larger issue is addressed. This technical nuance is the difference between losing a population and managing a crisis.
Final Thoughts
Interpreting a pond water test report with professional-level precision transforms pond management from a series of guesses into a controlled scientific process. By focusing on the interrelationships between pH, alkalinity, and the nitrogen cycle, you can maintain a stable environment that supports aquatic life and discourages nuisance algae.
Data is the most powerful tool in your maintenance kit. Consistent monitoring and trend analysis allow you to spot subtle shifts in water chemistry before they manifest as visible problems. Whether you are managing a small koi pond or a large lake, the numbers on the report provide the objective truth needed for mechanical and chemical optimization.
Encourage yourself to look deeper than the “safe” ranges printed on the back of a test kit. Understanding the underlying stoichiometry and chemical equilibria will elevate your skills and ensure the long-term health of your aquatic ecosystem.

Frequently Asked Questions About How to Read a Pond Water Test Report Like a Professional
Why does my pond water test show zero ammonia but my fish are gasping?
Low dissolved oxygen (DO) is the most likely cause. Ammonia is only one part of the water quality equation. If the water is warm, it holds less oxygen. Furthermore, if you have a heavy algae bloom, the algae consume oxygen at night, leading to gasping fish in the early morning despite perfect nitrogen readings. You should test DO levels at sunrise to get an accurate assessment of the minimum oxygen availability.
What is the difference between KH and GH in a water report?
KH (Carbonate Hardness) measures the concentration of carbonates and bicarbonates, which act as a pH buffer. GH (General Hardness) measures the concentration of calcium and magnesium ions. KH is critical for pH stability and the nitrification process, while GH is essential for the biological functions and osmoregulation of fish. A professional report will show both, and they should be managed as separate but related mineral requirements.
How does temperature affect my water test results?
Temperature is a master variable that changes the toxicity and solubility of other parameters. Higher temperatures increase the percentage of toxic un-ionized ammonia and decrease the amount of dissolved oxygen the water can hold. When reading a report, always cross-reference your TAN and pH readings with a temperature-corrected ammonia toxicity chart to determine the true risk to your aquatic life.
Can I use a pool test kit for my pond?
Generally, no. Pool test kits are designed to measure high levels of chlorine and stabilizers, which are not present or desired in a pond environment. Furthermore, pool kits often lack the sensitivity required to measure low-level ammonia and nitrite concentrations. Professional pond management requires kits calibrated for the specific ranges found in biological systems, typically measuring in parts per million (ppm) or milligrams per liter (mg/L).
Why is my pH higher in the afternoon than in the morning?
This is a natural result of the photosynthetic cycle. During the day, plants and algae consume carbon dioxide (CO2) for photosynthesis. Since CO2 forms a weak acid (carbonic acid) in water, its removal causes the pH to rise. At night, the process reverses as plants respire, releasing CO2 and causing the pH to fall. A professional looks for a stable KH to minimize the intensity of this swing.