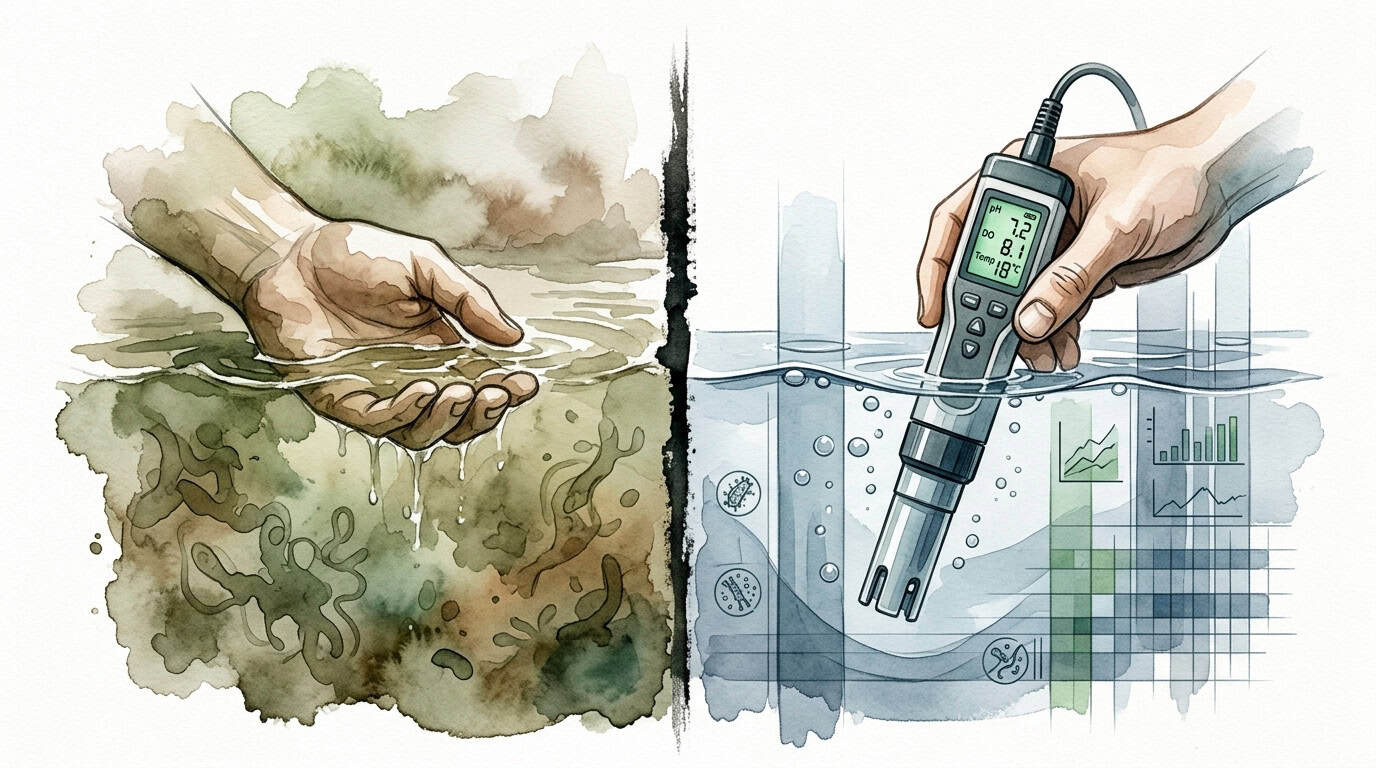
Stop guessing why your water is green; start measuring the truth with a simple baseline. Without a baseline, you are just guessing at your pond’s health. Learn how to track water quality like a pro today.
Establishing a water quality baseline involves the systematic measurement and recording of core chemical parameters—primarily pH, ammonia, nitrite, nitrate, and carbonate hardness (KH)—over a set period to define the “normal” state of your ecosystem. By documenting these metrics weekly under stable conditions, you create a data-driven reference point that allows for the immediate identification of biochemical shifts before they manifest as visual clarity issues or fish mortality.
How to Create a Simple Water Quality Baseline for Your Pond
A water quality baseline is a technical record of the chemical and physical characteristics of a pond’s water during a period of relative stability. In the context of aquatic engineering and pond management, this baseline serves as a control group for future data. It provides a numerical definition of health that is unique to your specific system, accounting for local source water, stocking density, and filtration efficiency.
Every pond operates as a closed-loop biological reactor. The interactions between nitrogenous waste, dissolved gases, and mineral buffers are constant and dynamic. Without a baseline, a pond owner cannot distinguish between a dangerous spike and a natural seasonal fluctuation. For example, a pH of 8.2 might be perfectly safe if it is consistent with your baseline, but if your baseline is 7.4, a reading of 8.2 indicates a significant chemical shift that requires investigation.
Real-world applications of baselining are found in professional aquaculture and high-end koi keeping. These environments prioritize mechanical optimization and biological stability. In these sectors, data collection is not a reaction to trouble; it is a fundamental maintenance protocol. By establishing what is “normal,” managers can optimize feeding schedules, calculate precise dosing for treatments, and predict oxygen depletion events before they occur.
The Parameters of a Comprehensive Baseline
To create a functional baseline, you must track specific variables that reflect the efficiency of the nitrogen cycle and the stability of the water chemistry. These parameters include:
- Ammonia (NH3/NH4+): The primary waste product from fish respiration and organic decay. A baseline should ideally be 0 ppm.
- Nitrite (NO2-): The intermediate stage of the nitrogen cycle. Like ammonia, this should remain at 0 ppm in a stable system.
- Nitrate (NO3-): The end product of biofiltration. Baseline levels vary but should generally stay under 40-60 ppm.
- pH (Potential of Hydrogen): Measures the acidity or alkalinity. Stability is more critical than the specific number.
- KH (Carbonate Hardness): Measures the buffering capacity. This prevents pH “crashes” by neutralizing acids produced by the nitrogen cycle.
- Dissolved Oxygen (DO): The amount of gaseous oxygen available for aquatic life, measured in mg/L or ppm.
Step-By-Step Protocol for Establishing a Baseline
Data acquisition must be consistent to be valid. Inconsistent testing methods or varying timeframes will introduce “noise” into your data set, making the baseline unreliable for comparison. Follow this protocol to ensure technical accuracy.
Phase 1: Standardization of Testing Tools
Select a testing method and adhere to it. Liquid titration kits, such as the API Pond Master Test Kit, are the standard for high-frequency hobbyist monitoring due to their reliability and cost-effectiveness. For practitioners seeking higher precision, digital sensors like the Seneye or YSI Pro Series provide continuous data logging and eliminate human error in color interpretation. Avoid test strips for baseline establishment, as they often lack the resolution required for nuanced data analysis.
Phase 2: The Initial Data Sprint
For the first 14 to 21 days, conduct tests daily at the same time. Morning testing is recommended because pH and dissolved oxygen levels are typically at their lowest point just before sunrise due to overnight respiration. This “sprint” captures the pond’s daily fluctuations and provides a high-resolution view of the system’s immediate response to feeding and weather events.
Phase 3: Transition to Weekly Monitoring
Once the initial 21-day period shows stable ranges, transition to weekly testing. Choose a specific day and time—for instance, Sunday at 8:00 AM—to maintain consistency. Record the results in a dedicated logbook or digital spreadsheet. Ensure you also record environmental variables such as air temperature, recent rainfall, and any mechanical changes made to the filtration system.
Phase 4: Seasonal Recalibration
A baseline is not static throughout the year. Biological activity increases with temperature. Consequently, a baseline established in January will not accurately reflect the system’s behavior in July. Perform a mini-sprint of three days of testing at the start of each season to adjust your baseline expectations for temperature-dependent parameters like dissolved oxygen and ammonia toxicity levels.
Strategic Advantages of Quantitative Monitoring
Transitioning from visual observation to quantitative monitoring provides several measurable benefits for pond management. The primary advantage is proactive risk mitigation. Most water quality issues are invisible until they reach a lethal threshold. A rising nitrate trend, for example, signals that your water change schedule is insufficient long before an algae bloom occurs.
Another benefit is cost efficiency. Pond owners often spend significant sums on “quick-fix” chemicals like algaecides or clarifies. With a baseline, you can identify the root cause—such as a KH drop leading to a pH swing—and address it with inexpensive minerals like baking soda rather than proprietary chemical cocktails. This data-first approach reduces the volume of additives required to maintain stability.
Furthermore, a baseline allows for precise medication dosing. If a fish becomes ill, many treatments are sensitive to pH and temperature. Knowing your baseline parameters ensures that you do not inadvertently increase the toxicity of a treatment, such as using formalin in low-oxygen conditions or chloramine-T in soft water with low KH.
Systemic Challenges and Procedural Errors
Errors in data collection can lead to “false positives” or, more dangerously, a false sense of security. One of the most common mistakes is improper reagent handling. Titration chemicals have expiration dates and are sensitive to light and temperature. Using expired reagents will yield inaccurate results, typically showing lower toxin levels than actually exist.
Failure to account for diurnal fluctuations is another frequent error. Photosynthesis increases pH and DO during the day, while respiration decreases them at night. If you test in the afternoon one week and the morning the next, the data will suggest a volatility that may not exist. Consistency in the timing of your samples is non-negotiable for a valid baseline.
Mechanical interference can also skew results. Testing water immediately after a large water change or right after a heavy feeding will provide a “snapshot” of a temporary spike rather than a baseline reading of the system’s resting state. Always allow the pond to reach an equilibrium for at least four hours after a significant event before taking measurements.
Environmental and Mechanical Limitations
Environmental factors can impose limits on how “simple” a baseline can be. In areas with high levels of agricultural runoff, source water may contain varying levels of nitrates or phosphates. In these cases, you must baseline your source water as well as your pond water. If your tap water contains 10 ppm of nitrate, your pond baseline will naturally be higher, and your management strategy must account for this baseline “load.”
Mechanical limitations of the filtration system also dictate the baseline. A pond with a small pressurized filter will have a much higher ammonia “recovery time” after feeding than a pond equipped with a large-scale moving bed biofilm reactor (MBBR). Understanding the mechanical limits of your hardware helps you set a realistic baseline for your specific setup.
The Guesswork Era vs. The Data Era
Historically, pond management relied on “The Guesswork Era,” where decisions were made based on water clarity and fish behavior. While observation is valuable, it lacks the precision required for modern, high-intensity systems. “The Data Era” utilizes specific metrics to drive decision-making.
| Factor | The Guesswork Era | The Data Era |
|---|---|---|
| Decision Driver | Visual clarity and “greenness” | Quantitative chemical analysis |
| Response Type | Reactive (fixing a problem) | Proactive (preventing a trend) |
| Maintenance Cost | High (emergency chemicals) | Low (targeted adjustments) |
| Risk Level | High (invisible toxins) | Low (monitored thresholds) |
| Efficiency | Low (trial and error) | High (mechanical optimization) |
Practical Tips for Log Accuracy and Calibration
To maintain a high-quality baseline, you must ensure your data is accurate and well-organized. Use these technical tips to refine your process:
- Rinse vials with pond water: Before testing, rinse your test tubes three times with the water being tested. Residual tap water or old reagents can contaminate the sample.
- View results in natural light: Colorimetric tests are designed to be read under natural, indirect sunlight. Artificial indoor lighting (especially yellow-hued bulbs) can make a 0 ppm ammonia reading look like 0.25 ppm.
- Calibrate digital probes monthly: If using electronic meters, use calibration fluids (buffer solutions) to ensure the sensors haven’t “drifted” over time.
- Digitize your log: Use a spreadsheet like Excel or Google Sheets. This allows you to generate trend graphs, which are far more useful than a list of numbers for spotting slow, systemic changes.
Advanced Parametric Analysis
For the serious practitioner, adding advanced parameters to the baseline provides a deeper understanding of the pond’s Oxidative-Reductive Potential (ORP) and electrical conductivity. ORP measures the “cleanness” of the water or its ability to break down organic waste. A baseline ORP of 250mV to 400mV indicates a highly efficient, well-oxygenated system.
Conductivity and Total Dissolved Solids (TDS) measurements help track the “age” of the water. As water evaporates and chemicals are added, the concentration of dissolved minerals increases. By baselining your TDS, you can determine exactly when a water change is required based on mineral buildup rather than a simple calendar schedule. This is the pinnacle of water quality management.
Example Scenario: The Silent KH Crash
Consider a pond with a stable baseline: pH 7.8, KH 120 ppm, Ammonia 0 ppm. Over three weeks, the owner notices the KH baseline trending downward: 100 ppm, then 80 ppm, then 50 ppm. In the “Guesswork Era,” the owner would do nothing because the water looks clear. However, in the “Data Era,” the owner recognizes that the biological filter is consuming the carbonate buffer to process ammonia.
By identifying this trend, the owner adds calcium carbonate or sodium bicarbonate to bring the KH back to 120 ppm. This prevents a “pH crash,” where the pH suddenly drops to 5.0, killing the beneficial bacteria and the fish. The baseline data allowed for a $5 fix before it became a $5,000 catastrophe.
Final Thoughts
Creating a water quality baseline is the single most effective step toward professional-grade pond management. It shifts the burden of care from reactive panic to systematic oversight. By dedicating time to initial daily testing and subsequent weekly logging, you build a technical foundation that ensures the long-term health of your aquatic ecosystem.
The transition from guessing to measuring is a hallmark of an advanced hobbyist. Data does not lie; it provides an objective truth that visual observation simply cannot match. Start your log today, standardize your methods, and stop wondering why your pond behaves the way it does.
As you become more comfortable with the core parameters, consider exploring automated monitoring systems. These tools offer real-time data streams that can be integrated with your manual baseline for the ultimate in mechanical and biological optimization. The path to a thriving pond is paved with data.
Frequently Asked Questions About How to Create a Simple Water Quality Baseline for Your Pond
How long does it take to establish a reliable water quality baseline?
A reliable baseline typically requires 21 days of consistent data collection. The first 14 days capture the pond’s reaction to current biological loads and filtration cycles, while the final week confirms the stability of these ranges. Once this initial period is complete, you have a statistically significant set of “normal” values. However, keep in mind that you should perform a shorter “mini-sprint” of three to five days during seasonal transitions—spring, summer, and fall—to account for temperature-induced changes in biological activity and oxygen solubility.
Do I need expensive digital sensors to create a baseline?
No, expensive sensors are not a requirement. A high-quality liquid titration kit, such as the API Pond Master Test Kit, provides sufficient accuracy for establishing a baseline for most ornamental ponds and water gardens. The key to a successful baseline is not the price of the tool, but the consistency of its application. Digital sensors offer the convenience of automated logging and high-frequency data, which is beneficial for high-value koi or sensitive species, but manual titration remains the gold standard for many professional pond managers due to its reliability and simplicity.
Why is my pH different in the morning than in the evening?
This is a natural biological phenomenon known as the diurnal cycle. During the day, algae and aquatic plants perform photosynthesis, which consumes carbon dioxide (CO2). Since CO2 acts as a weak acid in water, its removal causes the pH to rise. At night, photosynthesis stops, and all organisms—including fish, plants, and bacteria—continue to respire, releasing CO2 back into the water, which causes the pH to drop. This is why it is critical to test at the same time each day for your baseline. Testing in the early morning provides the most “stress-intensive” data point for your system.
Can I use test strips for my pond’s water quality baseline?
Test strips are generally not recommended for establishing a technical baseline. While they are convenient for quick spot checks, they often lack the precision and resolution required to detect subtle trends. For example, a test strip may only show increments of 0.5 or 1.0 for certain parameters, whereas a liquid kit or digital meter can provide 0.1 or 0.25 resolution. In the “Data Era” of pond management, these small increments matter. To build a baseline you can trust for high-stakes decisions, invest in a liquid reagent kit or a calibrated digital meter.
What should I do if my baseline readings are “out of range”?
If your initial baseline tests show parameters outside of ideal ranges—such as ammonia above 0 ppm or KH below 50 ppm—your first step should be to stabilize the system before finalizing the baseline. Perform partial water changes, check your filtration mechanics, and ensure you aren’t overfeeding. A baseline should reflect a healthy, stable state. If you baseline a “sick” pond, you are essentially normalizing a dangerous condition. Once the water chemistry is brought within safe parameters and remains there for a week, you can begin the 21-day recording process to define your official baseline.